'data.frame':   144 obs. of  3 variables:
 $ Sex: Factor w/ 2 levels "F","M": 1 1 1 1 1 1 1 1 1 1 ...
 $ Bwt: num  2 2 2 2.1 2.1 2.1 2.1 2.1 2.1 2.1 ...
$ Hwt: num 7 7.4 9.5 7.2 7.3 7.6 8.1 8.2 8.3 8.5 ...Introduction to Quarto
Quarto
Introduction
Quarto documentation and gallery can be found on their website.
Quarto cheatsheet
Below are some examples of the features that were added to RMarkdown notebooks.
Additional text formatting:
Check boxes
Interrupted lists
A list whose numbering continues after
an interruption
Term definition
- Quarto
- An open-source scientific and technical publishing system
Show code and hide code in the output
By default the code is executed, displayed in the output and output is rendered under it:
echo option allows to display the output, but not show the code
'data.frame':   144 obs. of  3 variables:
 $ Sex: Factor w/ 2 levels "F","M": 1 1 1 1 1 1 1 1 1 1 ...
 $ Bwt: num  2 2 2 2.1 2.1 2.1 2.1 2.1 2.1 2.1 ...
 $ Hwt: num  7 7.4 9.5 7.2 7.3 7.6 8.1 8.2 8.3 8.5 ...
eval option allows to display the code, but not evaluate it. Additionaly, if we set cold-fold option to true, the code chunk will be displayed and not “folded” under Code arrow:
str(cats)Automatic Figure labeling
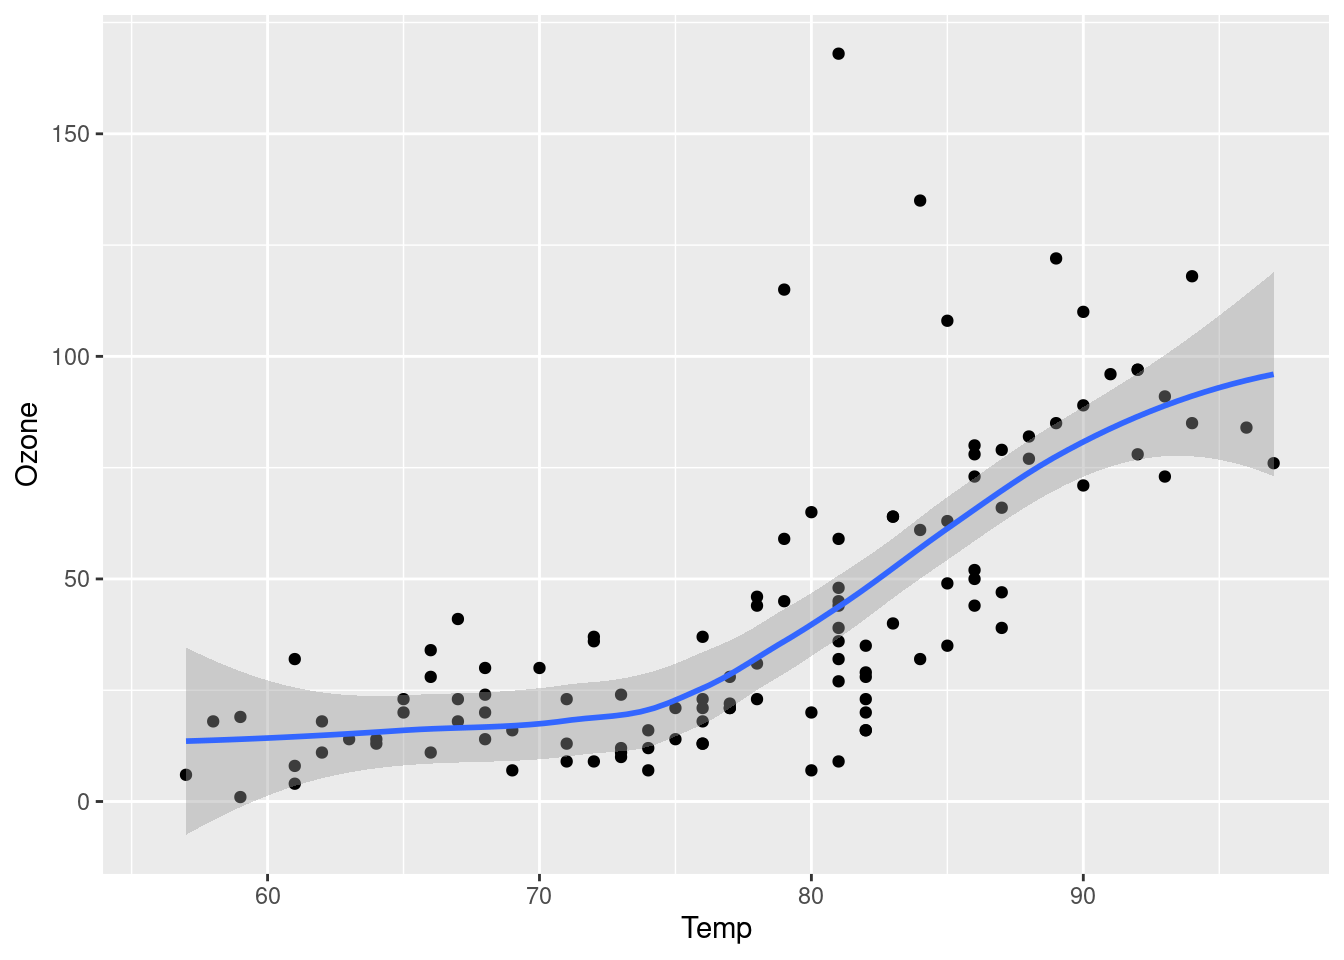
Figure 1 explores the impact of temperature on ozone level.
Code
library(ggplot2)
data(airquality)

ggplot(airquality, aes(Temp, Ozone)) +
  geom_point() +
  geom_smooth(method = "loess"
)
Code Linking
The code-link option in the header enables hyper-linking of functions within code blocks to their online documentation
Themes
There are currently 25 themes included in the Quarto. You can set a theme by adding a theme option to the header (e.g. theme: darkly)
More on themes, can be found Quarto’s HTML Themes webpage
Lightbox
This feature is available only starting from Quarto version 1.4.
Lightbox images allow a reader to click to see a larger version of the image (including any caption).
To enable lightbox treatment for all images in a document add lightbox: true in the YAML header.
If you want to add this feature only to a specific image, add a {.lightbox} code after the link to the picture.
If you add lightbox: auto option into the YAML header, the graphs you produce in your computational cells will also have a lightbox treatment.
More on this feature can be found on Quarto’s [](More on themes, can be found Quarto’s Lightbox Figures webpage
Callouts:
The callout-note can be used to draw attention to some information
The callout-warning can be used for warnings
The callout-important can be to highligh important information
This is an example of a callout with a title.
This is an example of a ‘folded’ caution callout that can be expanded by the user. You can use collapse="true" to collapse it by default or collapse="false" to make a collapsible callout that is expanded by default.
